Loading...
Off Grid Electricity Use on the Navajo Nation Webinar Recording
Iana Aranda, President of E4C
Hello, everybody, welcome. We're just gonna give folks one minute to join. We see you all hopping online
Iana Aranda, President of E4C
Well, colleagues, good morning. Good afternoon. Good evening, depending on where you're joining us from today. It is a pleasure to have you here with us today. My name is Jana Aranda. I'm the President of Engineering for change. And I am so pleased to welcome you all to today's webinar with our incredible panel comprised of Henry Louis, Derek Terry and Mohammed Boehm, who will be giving us some insights on their work, buying data driven design for awkward systems, and specifically looking at the case study of delivering electricity on the Navajo Nation here in the United States. So for those of you who are joining us for the very first time today, I want to tell you a little bit about our organization engineering for change are you for C for short, is a nonprofit organization founded jointly by the American Society of Mechanical Engineers or ASME, as well as other engineering associations to prepare, educate and activate the international technical workforce, to advance quality of life and ensure that we benefit people and planet. Diversity. We provide upskilling and professional development opportunities at the intersection of engineering and sustainable development for global community, and particularly early career technical professionals through programs such as our engineering for change fellowship. And we support mission aligned organizations to achieve their sustainability objectives through our impact projects and services. There are more than 54,000 engineering for change members worldwide and a global audience of over 1 million people that believe engineering can change the world, I'm sure that you all count yourselves amongst that community. For us, for more information about the foresee our programs, and every opportunity that is available to you as members, I urge you to visit our website, the link should be in the chat shortly. And of course, invite you to visit us follow us on our social media channels. So I know that many of you since COVID, are probably experts in zoom and likely don't need this. But for those of you who are maybe joining us for the first time, I would like to make sure that we are getting familiar with the really critical functions, including chat. So at this time, we would like to invite you to please into the chat window, enter your location. Where are you joining us from today. I'm joining you today from Brooklyn, New York. I would love to see where you're joining us from today. If you don't see your chat window, just go to the bottom of your screen and type on the little icon. So we see folks from Ecuador and Somalia, Pakistan, and Wanda Seattle and Manchester, Nairobi, Jakarta. I don't know that flag Oh, who put the flag and helped me out here Malawi and Amsterdam. Welcome. Welcome, everyone. It's such a pleasure to have you from Yebin to Canada. thrilled to welcome you today to our webinar. Again, if the chat is not open on your screen, look for the chat icon on the bottom in the middle of the slides. And second, if you have any questions during the webinar, we encourage you to please use the q&a button in order to enter your questions so we can keep track of them for our presenters. Do not just enter them into the chat however you are of course welcome to converse with your fellow webinar, participants in that chat window or share any tips or any reflections. So if you're following us on Twitter today, please do follow up join the conversation with our dedicated hashtag hashtag e foresee webinar series. So again, really pleased to see the global representation today on on here. I see Slovenia and New Mexico, Nigeria, and Sweden and this is the I have not seen people enter their flag icons and it's really testing my my skills here. So thank you for that. I'm going to have some fun with flags later. Really appreciate appreciate you all being creative in your responses. So with this introduction, I would like to now turn it over to our fearless panelists to introduce themselves starting with Dr. Henry Louis
Dr. Henry Louis, Seattle University / Kilowatts for Humanity
All right, good. Well, where I'm at, it's morning time. So I'll say good morning to everyone. It's where the three of us are so excited to be here to, to be presented to such an international audience on a topic that we find very interesting. And it's always nice to see that so many people across the globe are also interested in our topic. We'll start by doing some brief introductions of the folks that will be speaking to you today. And then we'll get right into the meat of it. So let me let me go ahead and go first. My name is Henry Louis. I'm a professor of Electrical and Computer Engineering at Seattle University. We are a school of private Jesuit university in Seattle. I also am the president and co founder of a nonprofit organization called kilowatts for humanity. And we do electricity access, primarily in, in and around Sub Saharan Africa. I've also been on various IEEE committees and other leadership positions. So it's really exciting for me to talk to you this morning and joining me today. We have Derek carry Derek, if you want to unmute and do a quick intro that would be delightful.
Derrick Terry, Navajo Tribal Utility Authority
Okay. Good morning, everybody. My name is Derrick Terry, renewable energy specialists here for the Navajo tribal utility authority. And I'm glad that you know, all the wonderful people in literally across the world. You know, I see all the the chat rooms and um, oh my gosh, I thought that word is limited to Arizona. But I guess it's all over. Welcome. And we can dive into it here a little bit more. discussion starts. But thank you and welcome. Great.
Dr. Henry Louis, Seattle University / Kilowatts for Humanity
And then last, but certainly Last but certainly not least.
Muhammad Baum, E4C Sr. Fellow
Hello, everyone. My name is Muhammad Baum. I'm a PhD candidate in Industrial and Systems Engineering at Virginia Tech. And I joined e foresee as follow last summer. And now I'm serving as a Senior Fellow. I'm always interested in finding intersection between engineering and global development. And I'm really excited to be here with you.
Dr. Henry Louis, Seattle University / Kilowatts for Humanity
Okay, thank you, Mohammed and, and Derek. So to kind of center our discussion this this morning, because what we're really talking about is electricity access. And it is maybe surprising to some of you, but certainly not all of you based upon the locations in the chat that many places in the world struggle with access to electricity. And unfortunately, the Navajo Nation on parts of it is one of those locations. To paint the broad picture, you know, we would describe access to electricity or not having access to electricity is a form of energy poverty. So energy poverty, a very simple definition is it's the lack of access to modern fuels. Now globally, over 2 billion people, you know, rely on solid biomass or cooking and heating, for cooking and heating, things like crop residue done charcoal or wood. That's how they heat their homes and cook cook their food. A smaller amount, although certainly substantial is 733 million people don't have access to the electricity grid. So that's approximately one out of every 10 people on the planet. And I should note that a far greater number than this might have electricity going to their house, but it is unreliable or unaffordable. So 733 million is sort of the accepted lower bound of that number.
Derrick Terry, Navajo Tribal Utility Authority
So where do people
Dr. Henry Louis, Seattle University / Kilowatts for Humanity
live,  that don't have access to electricity? Well, primarily, it's in Sub Saharan Africa and villages like this. This is a village in Zambia, there's no power lines that make it to this village. And so this is endemic across the continent, Sub Saharan Africa, so 70% of the people without access to electricity live in Sub Saharan Africa, another 20% live in South Asia, and 10% live in the rest of the world. And in my work. In my work history, typically, you find that a lot of organizations, a lot of attention is focused on Sub Saharan Africa and South Asia and not that rest of the world slice. So it's important to not forget that even in places like the United States, and a lot of our tribal communities, there are homes that don't have access to electricity. Some estimates that I've seen in North America put the number of people without access to the grid to be somewhere north of 100,000 people, which is a significant amount, maybe even up to 200,000 depending on what you what you count as access and what you don't. So our webinar today is primarily going to focus on this, this electricity access on the Navajo Nation. And the challenges with that, but also the opportunities and and what we've learned from off grid electrification on the Navajo Nation. So let me just give you just a very brief background of the electricity access situation. In the United States, rural electrification really took off in the 1930s, with the intervention by the federal government that provided huge subsidies and loans to electrify rural areas. However, Navajo Nation, like many tribal communities, tribal lands in the United States were overlooked by that government intervention. So they didn't, they didn't receive the benefits.
  Now reality of the situation is that to extend a power line, you know, usually cost somewhere between 20 to $40,000 per mile, it's quite expensive. On the Navajo Nation, some of the homes are so remote, that there may be 40 miles from the nearest power line. So you can think about how much it would cost to extend the power line to that one home that is 40 miles away, it would be over a million dollars. And it makes sense then that, you know, it's it's not the highest priority, or it's not really economically justifiable to spend a million dollars to connect one home. In addition, Navajo Nation and historically they've been raised sheep and goats and horses and so forth. And so it's a pastoral community, where they are used to having lots of land surrounding their homes with neighbors quite far away. So there's low population density. So you combine the remoteness, the sparse population, you put those together, and it's a perfect recipe for low electrification, it will require substantial subsidies to connect all the homes. So as a result, there's about 10,000, maybe even 20,000 homes that aren't connected to the grid on the Navajo Nation, progress as is being made, but it's still a substantial gap. And the Navajo Nation represents about, you know, the least electrified of all the US tribal reservations. So that's kind of a background. That's maybe why the situation is the way it is. And thankfully, the Navajo tribal utility authority has been making a lot of progress in in changing the situation. So let me turn it over to Derek here to talk a little bit more about NTU a.
+1
that don't have access to electricity? Well, primarily, it's in Sub Saharan Africa and villages like this. This is a village in Zambia, there's no power lines that make it to this village. And so this is endemic across the continent, Sub Saharan Africa, so 70% of the people without access to electricity live in Sub Saharan Africa, another 20% live in South Asia, and 10% live in the rest of the world. And in my work. In my work history, typically, you find that a lot of organizations, a lot of attention is focused on Sub Saharan Africa and South Asia and not that rest of the world slice. So it's important to not forget that even in places like the United States, and a lot of our tribal communities, there are homes that don't have access to electricity. Some estimates that I've seen in North America put the number of people without access to the grid to be somewhere north of 100,000 people, which is a significant amount, maybe even up to 200,000 depending on what you what you count as access and what you don't. So our webinar today is primarily going to focus on this, this electricity access on the Navajo Nation. And the challenges with that, but also the opportunities and and what we've learned from off grid electrification on the Navajo Nation. So let me just give you just a very brief background of the electricity access situation. In the United States, rural electrification really took off in the 1930s, with the intervention by the federal government that provided huge subsidies and loans to electrify rural areas. However, Navajo Nation, like many tribal communities, tribal lands in the United States were overlooked by that government intervention. So they didn't, they didn't receive the benefits. +1
Now reality of the situation is that to extend a power line, you know, usually cost somewhere between 20 to $40,000 per mile, it's quite expensive. On the Navajo Nation, some of the homes are so remote, that there may be 40 miles from the nearest power line. So you can think about how much it would cost to extend the power line to that one home that is 40 miles away, it would be over a million dollars. And it makes sense then that, you know, it's it's not the highest priority, or it's not really economically justifiable to spend a million dollars to connect one home. In addition, Navajo Nation and historically they've been raised sheep and goats and horses and so forth. And so it's a pastoral community, where they are used to having lots of land surrounding their homes with neighbors quite far away. So there's low population density. So you combine the remoteness, the sparse population, you put those together, and it's a perfect recipe for low electrification, it will require substantial subsidies to connect all the homes. So as a result, there's about 10,000, maybe even 20,000 homes that aren't connected to the grid on the Navajo Nation, progress as is being made, but it's still a substantial gap. And the Navajo Nation represents about, you know, the least electrified of all the US tribal reservations. So that's kind of a background. That's maybe why the situation is the way it is. And thankfully, the Navajo tribal utility authority has been making a lot of progress in in changing the situation. So let me turn it over to Derek here to talk a little bit more about NTU a. Derrick Terry, Navajo Tribal Utility Authority
Let's see. Derek you are muted. Sorry. Okay. There we go. Good morning. Again, my name is Derrick Terry, the renewable energy specialists here for that will try the utility authority. We have a company that is located here in Fort Defiance, Arizona. We are part of seven different, you know, districts with throughout the whole Navajo Nation. So within our company, you know, I'll just do a quick rundown of what we do. And so within our company, what we cover is their electric distribution transmission throughout the whole Navajo Nation, as well as communication, whether it be broadband fiber, or you know, mobile, wireless, natural gas, water, wastewater, and, you know, photovoltaics. So that would be on grid as well as often. And then are the last is our off grid systems. So one of the stats I want to add in the in the first slide here is estimated that 31% of homes lack complete plumbing 28% lack kitchen facilities, 38% lack water services, 30% 32% lack electricity 86% You know, natural gas services, inspiringly 60%, lack, you know, regular landline telephone services. So, then a composite, you know, where to majority utility company that, you know, oversees all these utilities around the whole Navajo Nation. So if you jumped to the next slide, Henry, so United's, the the Navajo Nation, you know, it covers four states. So we go into Colorado, Utah, Arizona, as well as New Mexico with a complete area of you know, almost 18,000 square miles. So it's a significant amount of area and a lot of it is still very, very remote. The distances that our crews travel for outages for installations of different utilities is substantial, you know, for you to go from one end denomination all the way to the next, you know, it could easily take you six, eight hours depending on the route that you take. And so, hence the districts throughout the various area Because of the Navajo Nation, and right in the middle there, if you can see it a little area that is the Hopi reservation. So hope, hopefully is lucky that the Navajo is surrounded by a fellow Hopi. So, but they're good, they're good neighbor to us, and we're good neighbor to them. So we help out on a lot of different projects. But in reality, you know, that's the size of the Navajo Nation as it is currently. Next slide. And so, you know, with the, with the inception of NT way, one of the one of the programs that was thought about way early on back in the, I want to say late 1980s, was the use of solar panels, and renewable energy. So if you guys don't remember, you know, solar is relatively new. There wasn't schools weren't doing it. Community colleges aren't teaching it. But now, if you go out and you just walk a few feet, everybody's talking about renewable energy, everybody's talking about sustainability. And that's the new, the new go to work. But I'm glad that the council here with the nomination, as well as leaders here at Auntie way, they had a little bit of fourth time. So, back in the late 1980s, I believe was 1989, we had our first, you know, I believe was a 200 watt panel that we had, I think it was like for them. So back in the day, they didn't have a 200 watt panel, I think they had like 60 Watt, or 40 watt panels. And then you just wired them on a series with the, maybe a couple of this regular offline car batteries. So back then, you know, one of the things that we want to build early on, we want to be an example for other native communities that are in our same type situation. And so why is that? We got to stress the importance of energy efficiency, and teach that to everybody within the household. Why? Because, you know, the poverty level, low income, you know, unemployment rates, all time highs go now when they should. So I did write down a couple of notes here. So for reference, you know, the unemployment rate right now is 48.5%, we're on applanation. So that that is high, you know, super, super high. And then you have that you have the average household income is right above $8,000. Not per month, not per year, not by annually, but per year, just imagine you're trying to live on $1,000. You know, for one year, we're trying to support a family, very difficult to do much less trying to get electricity through your house. So it is a struggle here on Navajo. So we want to. So to help ease some of the struggles and difficulties of these families. We want to stress, energy efficiency, energy sustainability, so why so you can limit the amount of resources that come out of your pocket. So you buy the better appliance you buy, you know, something that's going to last you for a long time, although the upfront costs might be high, you make it lasts a little bit longer than that it easier wallet just a little bit more. So next leg. So one of the solutions that we came up with was for two remote families that won't ever have grid connection. And those are different reasons that you know, that could happen. One of it is terrain. And secondly, is this the feasibility of it economically, it doesn't make sense to within 20 miles of a hard line just for one family. You know, if you're putting in 10,000 20,000 $30,000, maybe even 100 depending on the terrain $1,000 just to run for that one customer that's just not feasible. So what we ended up doing is we give the family an option to run their home off of solar with the energy storage bank and given them power, when it was first inception of the program. The the main direction of the solar unit was for safety. Because the amount of distances that you have to travel here on Navajo just to get to health healthcare facility could be hours, easily hours, especially if you don't have a vehicle. A lot of them you have to leapfrog you know to call one family that might have a vehicle and then they take you and then their ride might not be very reliable. So they take you to point B, then you have to go from point B to C all the way until you finally get to the health care facility that you need. And a lot of these families that I had in the remote areas are elderly folks. So just imagine if if you have no lights if you're living off of a kerosene lamp, or a propane lamp that you you know, I don't know if you guys ever had the opportunity to pump that cares You know that propane, and you pump that little thing and you get light. That's a very real situation right now, kerosene is still used, if you go to a gas station, you still have kerosene and the gas stations, because people still use them. So the main importance of solar is light, we want to get light for these families. So at night, my elderly folks, they won't trip, they won't fall, they won't hurt themselves. And that's the reason as the main push of the original solar units, as years went on, you know, the solar got more efficient, batteries got more reliable, the knowledge base group. So like I was saying, You can want to hear anything about solar, you know, years down the road, but now you can, now you go to community college, now you go to university, now you have degrees in this stuff. So with that new knowledge becomes the advancement in the technology of the systems. So as a result, if you look at the screen, now, these are new systems are 3000 Watt systems, they have the ability to run a water pump, to run your system and system, they're separate. You know, they have the ability to run an 18 cubic foot refrigerator. And not only that, but you don't have, you know, the reliability of the batteries a little bit better. So that, you know, the system has three days of autonomy. So they're in our long storms. So you, if you don't believe in Arizona, we experienced all four seasons. Henry can attest to that we just came to a three day storm out of Seattle, he never knew. And then this was this week and a half two weeks ago. So we experienced the full gamut, you know, we've experienced 100 degree weather, then we experienced the minus 10 degree weather. So the systems are definitely tested here in Arizona. So we have our trials and tribulations with them. We're almost like a testbed in certain times. We definitely run these systems all the way through, and we run them to the ground sometimes. And so what the whole point of having to try to get these family reliable electricity. So right now currently within our program, it has 500 on here, but we just added another 100. So we're about 600 systems that we have out in the field right now for these families. And so with the seven districts across the Navajo nation with three to four, you know, trained personnel, they have the ability to go out and touch the systems if needed in the event of an outage. So they go out and they service them, they maintain them, and they keep them running. So
Derrick Terry, Navajo Tribal Utility Authority
three days of autonomy. We treat them like the regular outage. So we have an issue with the systems, it's not up to the customer. to service these things, it's up to us into the way that the battery goes out. If a panel gets damaged, if the inverter goes out anything, anything with a system, Intuit takes care of that costs. So that's a benefit to the customer, because the customer again, you go back to the average monthly income of $8,000, there is no way even if they say they're going to replace the battery bank at $7,000 just going to take them 1520 years to even try to get up to that point. So to relieve the stress of that family into a you know, picks up the cost for them. So they can be substantial. So there's many things that go in place your education to the family, you got education to our workers that go online, to try to keep the systems up and running and reliable. So it is a big endeavor, and a big job that we do here, we're going to wait for these families as well as the solar units to keep them running. So next slide. And so the off grid systems themselves, you know, we got 300 of the, of the solar. So these are the different inverter types that we're calling out. So basically a 300 watt system 300 Watt, or 3000 items or the 1000 watt system. 300 are the Sol arc inverter main system, and then you got the 150 Outback radian series systems, so two different systems and they're providing power to our off grid systems. And so with the help of Henry, all these systems are tied to a SAM Sarah. Monitoring System. Henry can probably talk about a little bit more of the specifics on the SAM Sarah, but all of them, you know, they all company back to one database and Henry has access to them.
Dr. Henry Louis, Seattle University / Kilowatts for Humanity
Yeah, that's right. So as as Derek said, these are the systems that we're going to be considering in our case study. In fact, we're looking specifically At the 150 of the 300 Solarek, the 150 that were looking at were installed a couple of years ago, the the additional ones have installed, been installed more recently. Here's just some more pictures. It's a 3.8 Kw system, it's bifacial. So the array actually has cells on the back of it to get some reflected irradiance. And here's the batteries there. 16 of them, they're gel lead acid batteries, each each batteries about 200 amp hours a pop. The system schematic looks something like this, of the there's two, the array is broken into two sub arrays, we have our battery bank here, eight kW inverter. Now, as Derek said, we are collecting lots and lots of data from this gigabytes worth at this point. But the the data that we're really going to focus on for most of this talk is here, it's the data going to the homes exceeds the power going to the homes. So one of the research questions that we're asking is, well, how much power do people use from these systems? Because really, it's important to understand that to understand should the systems, the larger or smaller, how reliable are they excetera. So we're really going to focus on how people can use the electricity from these systems, we have an opportunity to look at 150 of them for multiple years at this point. And it's really a study like no other the amount of data that we're getting is truly amazing. And NCUA had some good force force thought into equipping them with these in these data acquisition systems. So it's an amazing opportunity to to learn what's going on. Now the data is sampled sometimes multiple times a minute. But basically what we do is we we sample the the power output, and we convert it to 10 minute averages. And then we do our analysis and the analysis that I'm talking about. Basically, consider January 1 to the end of December 2022. So two year period, some of the analyses go all the way up to March, however. So let's jump right into it. Then. Let's look at the energy consumption characteristics. Well, one of the first things that you'll note when you start looking through the data is that there's a diversity in the consumption. Not all the homes, although they all have the same system all are located on the Navajo Nation, they don't all have the same daily pattern. What you see here are just four examples of daily electrical energy use, some of the homes exhibit wide variety. So they might have days where they're they're fairly low, some days where they they're fairly high consumption sub are fairly consistent, same day to day day energy use, some have strong seasonal patterns. Some have something happened in the home and their consumption either decreased or maybe it increased. But the overall takeaway here is that there's just not one profile, there's just not one typical consumption characteristic. Which means that we have to be a little more nuanced in our approach, right? That there's a variety of consumption patterns, not unlike what you would find really anywhere else in the world.
Derrick Terry, Navajo Tribal Utility Authority
So one of the things that
Dr. Henry Louis, Seattle University / Kilowatts for Humanity
we're 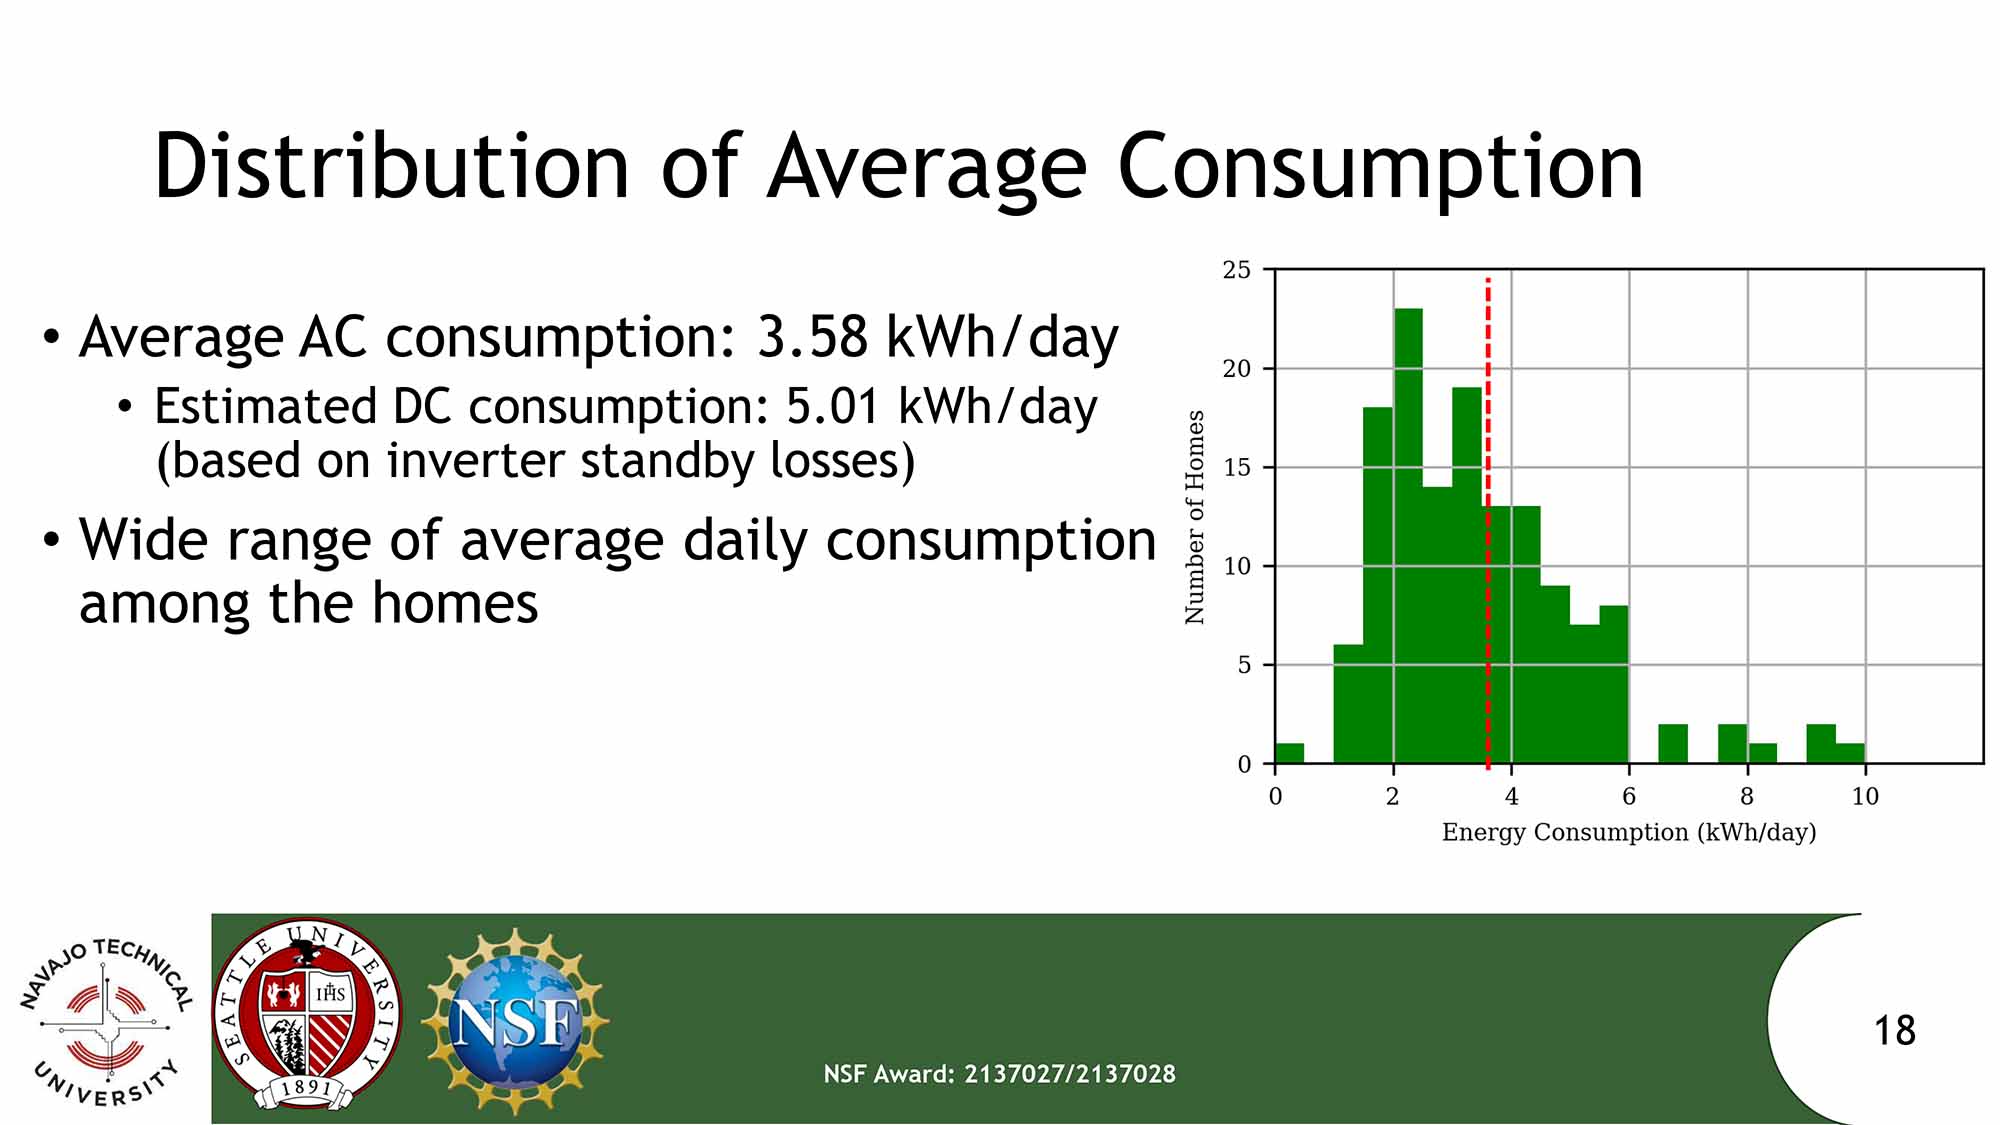
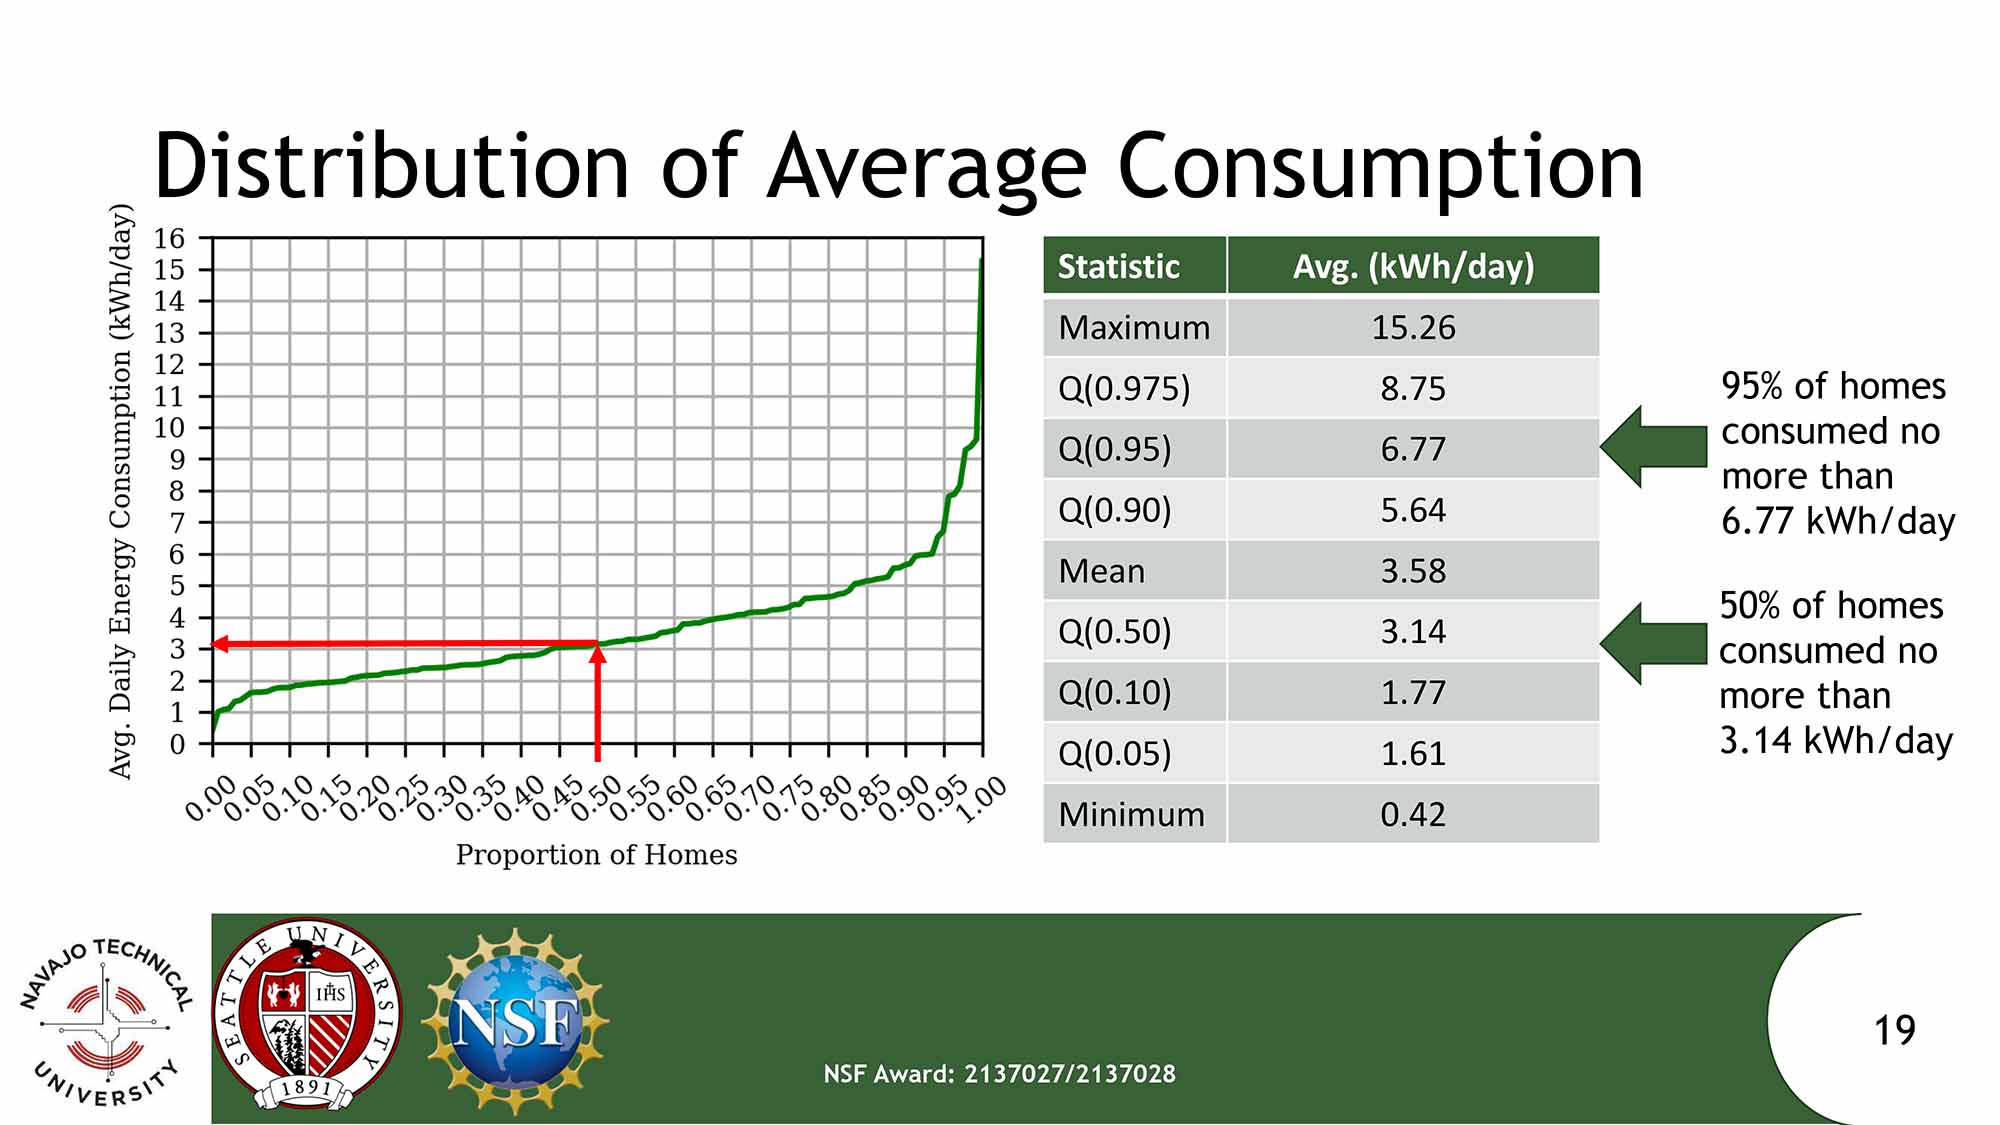 really interested in is how has consumption changed on the longer term. So what we did is we looked at the total consumption took the average of it of all the homes per month from inception. So this goes all the way up to about March of this year. And, you know, we do notice a couple of attributes here, right, we noticed that there is a seasonal profile here that tends to peak in the summer. This is interesting. There may be a couple of reasons why for this. One is that there could be some electricity that's used for cooling. We also think that there it could be attributed to work in school patterns which have a seasonality to IT people children might be or adults might be home during the summer, more people in the home usually means more electricity uses. It also could be related to the availability of the energy, sunnier in the summer, so maybe people know that they can consume more, more energy. One of the other things that we know is that there's actually from 2021 to 2022, a decrease in energy consumption. This is a little atypical from maybe your experience in Sub Saharan Africa where generally we see growth. There could be some reasons for that. One is that in 2021, the Navajo Nation, very much had COVID restrictions applied to it. So people were working from home. They stayed at home a lot more in 2021 than 2022. So as more people left the home and 2022 Maybe that had to do with the decrease. Maybe that was Despite the consumption decreased, it's also possible that the components made degraded from year 2021 to 2022, making less energy available. So we're doing some surveys and we're looking into this in more detail. But right now it's it's what the data is showing us that there is a decrease. Now, if we drill down, instead of looking at overall averages of all the homes, if we look at how much energy each home consumed on a particular day, and we plot the histogram of it, we get something that looks like this. So on the AC side, the average consumption was 3.58 kilowatt hours per day. But you can see from this distribution, there's a wide variety of that not every home consumed 3.58, right, there was a wide distribution, some consumed multiple times that some consumed far less than that. By the way, 3.5 kilowatt hours a day is is actually quite low, if you look at say New Mexico, their average for grid connected homes, it's more like 20 to 24 kilowatt hours per day. So this is still providing access to electricity, but it's not replicating the grid. And I think that's an important aspect. Now, if we look on the DC side of the system, the DC side of the inverter, the consumption is probably about five kilowatt hours a day. This is based on an estimated inverter losses. So that that jump from 3.58 to five has to do with the inverters, you know, its internal fans turning on its its keeping its own lights on etc. And that is actually more energy that that difference of about 1.5 kilowatt hours is about 15 to 20% of the homes actually consume less than that on the AC side. So it can be significant. And I know as a result of that, that understanding, NCUA is now installing systems with much smaller inverters to try to reduce those standby losses because eight kilowatts of consumption very rarely ever occurred. So this is what it looks like in form of a in the form of a histogram, if we wanted to look at it in a slightly different way. This is looking at the this is an empirical inverse cumulative distribution function where we can see the percentiles or quantiles, and how much they consumed. So as an example, if we look at the 50th percentile, that's the median. So half the homes essentially consumed more than 3.14 kilowatt hours a day half consumed less on either of the extremes, if we jump up to the 95th percentile, you know, then we get to 6.77 kilowatt hours a day. So 95% of the homes consumed no more than this. Understanding this curve is important in determining what's an appropriate size for your system. Generally speaking, we don't size around the maximum, we would design around maybe the 95th or 97th percentile, because we'll see, to meet the needs of everyone, you end up with a very, very large system. So you're if you want to as a little guide, this is how you would interpret that the 50th percentile, you draw a line straight up, and you would go to the left to see the consumption. Now homes consumed, generally had a wide variety and their daily consumption. So even within a home, there was a variety and consumption, some homes were a little more consistent than others, some exhibited a wide variety. So if you look at their average value, which is this dashed red line, some homes stayed, you know, within a multiple of it, some it was three or four or five times their average that they consumed on Sunday. So this could be days where maybe they had company over days at work was extremely hot or extremely cold, whatever the reason. And so this also this wide variety that that some of the homes exhibited makes it challenging to design the battery bank to figure out how many days of autonomy is actually provided. And, and it's important characteristic to look at on a per home basis, right, it's the variation that happened. Now just to provide a specific examples here are 25 homes and the box plot of their energy use. So what we see here is that little green horizontal line, that's the median daily consumption for that home, and then within the box, it's the 25th and 75th percentile. So it gives you an idea of the range that typically were exhibited by homes. You can see for most homes, the consumption is less than five kilowatt hours a day. Although there are some that is a bit higher, and some have small ranges, some have large ranges. One of the most important things to note here, if any of you are researchers that are trying to model off grid consumption is that the distributions aren't normal, they're not Gaussian distribution. So if you make that assumption that the day to day consumption follows a normal distribution, that's really not that accurate. These are these are, they don't follow any parametric distribution that I'm aware of, although maybe our future research tasks can be modeling, distribution functions to fit these. So they all exhibit sort of a Skewness in the positive direction with outliers.
+3
really interested in is how has consumption changed on the longer term. So what we did is we looked at the total consumption took the average of it of all the homes per month from inception. So this goes all the way up to about March of this year. And, you know, we do notice a couple of attributes here, right, we noticed that there is a seasonal profile here that tends to peak in the summer. This is interesting. There may be a couple of reasons why for this. One is that there could be some electricity that's used for cooling. We also think that there it could be attributed to work in school patterns which have a seasonality to IT people children might be or adults might be home during the summer, more people in the home usually means more electricity uses. It also could be related to the availability of the energy, sunnier in the summer, so maybe people know that they can consume more, more energy. One of the other things that we know is that there's actually from 2021 to 2022, a decrease in energy consumption. This is a little atypical from maybe your experience in Sub Saharan Africa where generally we see growth. There could be some reasons for that. One is that in 2021, the Navajo Nation, very much had COVID restrictions applied to it. So people were working from home. They stayed at home a lot more in 2021 than 2022. So as more people left the home and 2022 Maybe that had to do with the decrease. Maybe that was Despite the consumption decreased, it's also possible that the components made degraded from year 2021 to 2022, making less energy available. So we're doing some surveys and we're looking into this in more detail. But right now it's it's what the data is showing us that there is a decrease. Now, if we drill down, instead of looking at overall averages of all the homes, if we look at how much energy each home consumed on a particular day, and we plot the histogram of it, we get something that looks like this. So on the AC side, the average consumption was 3.58 kilowatt hours per day. But you can see from this distribution, there's a wide variety of that not every home consumed 3.58, right, there was a wide distribution, some consumed multiple times that some consumed far less than that. By the way, 3.5 kilowatt hours a day is is actually quite low, if you look at say New Mexico, their average for grid connected homes, it's more like 20 to 24 kilowatt hours per day. So this is still providing access to electricity, but it's not replicating the grid. And I think that's an important aspect. Now, if we look on the DC side of the system, the DC side of the inverter, the consumption is probably about five kilowatt hours a day. This is based on an estimated inverter losses. So that that jump from 3.58 to five has to do with the inverters, you know, its internal fans turning on its its keeping its own lights on etc. And that is actually more energy that that difference of about 1.5 kilowatt hours is about 15 to 20% of the homes actually consume less than that on the AC side. So it can be significant. And I know as a result of that, that understanding, NCUA is now installing systems with much smaller inverters to try to reduce those standby losses because eight kilowatts of consumption very rarely ever occurred. So this is what it looks like in form of a in the form of a histogram, if we wanted to look at it in a slightly different way. This is looking at the this is an empirical inverse cumulative distribution function where we can see the percentiles or quantiles, and how much they consumed. So as an example, if we look at the 50th percentile, that's the median. So half the homes essentially consumed more than 3.14 kilowatt hours a day half consumed less on either of the extremes, if we jump up to the 95th percentile, you know, then we get to 6.77 kilowatt hours a day. So 95% of the homes consumed no more than this. Understanding this curve is important in determining what's an appropriate size for your system. Generally speaking, we don't size around the maximum, we would design around maybe the 95th or 97th percentile, because we'll see, to meet the needs of everyone, you end up with a very, very large system. So you're if you want to as a little guide, this is how you would interpret that the 50th percentile, you draw a line straight up, and you would go to the left to see the consumption. Now homes consumed, generally had a wide variety and their daily consumption. So even within a home, there was a variety and consumption, some homes were a little more consistent than others, some exhibited a wide variety. So if you look at their average value, which is this dashed red line, some homes stayed, you know, within a multiple of it, some it was three or four or five times their average that they consumed on Sunday. So this could be days where maybe they had company over days at work was extremely hot or extremely cold, whatever the reason. And so this also this wide variety that that some of the homes exhibited makes it challenging to design the battery bank to figure out how many days of autonomy is actually provided. And, and it's important characteristic to look at on a per home basis, right, it's the variation that happened. Now just to provide a specific examples here are 25 homes and the box plot of their energy use. So what we see here is that little green horizontal line, that's the median daily consumption for that home, and then within the box, it's the 25th and 75th percentile. So it gives you an idea of the range that typically were exhibited by homes. You can see for most homes, the consumption is less than five kilowatt hours a day. Although there are some that is a bit higher, and some have small ranges, some have large ranges. One of the most important things to note here, if any of you are researchers that are trying to model off grid consumption is that the distributions aren't normal, they're not Gaussian distribution. So if you make that assumption that the day to day consumption follows a normal distribution, that's really not that accurate. These are these are, they don't follow any parametric distribution that I'm aware of, although maybe our future research tasks can be modeling, distribution functions to fit these. So they all exhibit sort of a Skewness in the positive direction with outliers. 
Dr. Henry Louis, Seattle University / Kilowatts for Humanity
On the positive side, very briefly, let
Dr. Henry Louis, Seattle University / Kilowatts for Humanity
me talk about about some load profiles. So this is some work that Scott O'Shea, who I think is in the audience worked on and it looked at consuming, like when when that energy is consumed over the course of the day, and generally we see that there in the late evening, consumption tends to be quite low, and then it rises in the morning, this is probably when people are getting ready for the day, we kind of plateau throughout the day, maybe even have a little dip, this could be refrigerator load, or you know, there might be some people home with some appliances on. But then we have a peak in the evening, maybe when people get back from work or whatever they were doing during the day. So it's kind of an evening peaking load, and then it decreases. The evening peaking load makes it challenging for solar, we generally want to have a daily, you know, a daytime peaking load. So it's more coincident with when the sun is producing energy. So this does pose a little bit of a challenge than to designing the systems. We also looked at how it varied from one season 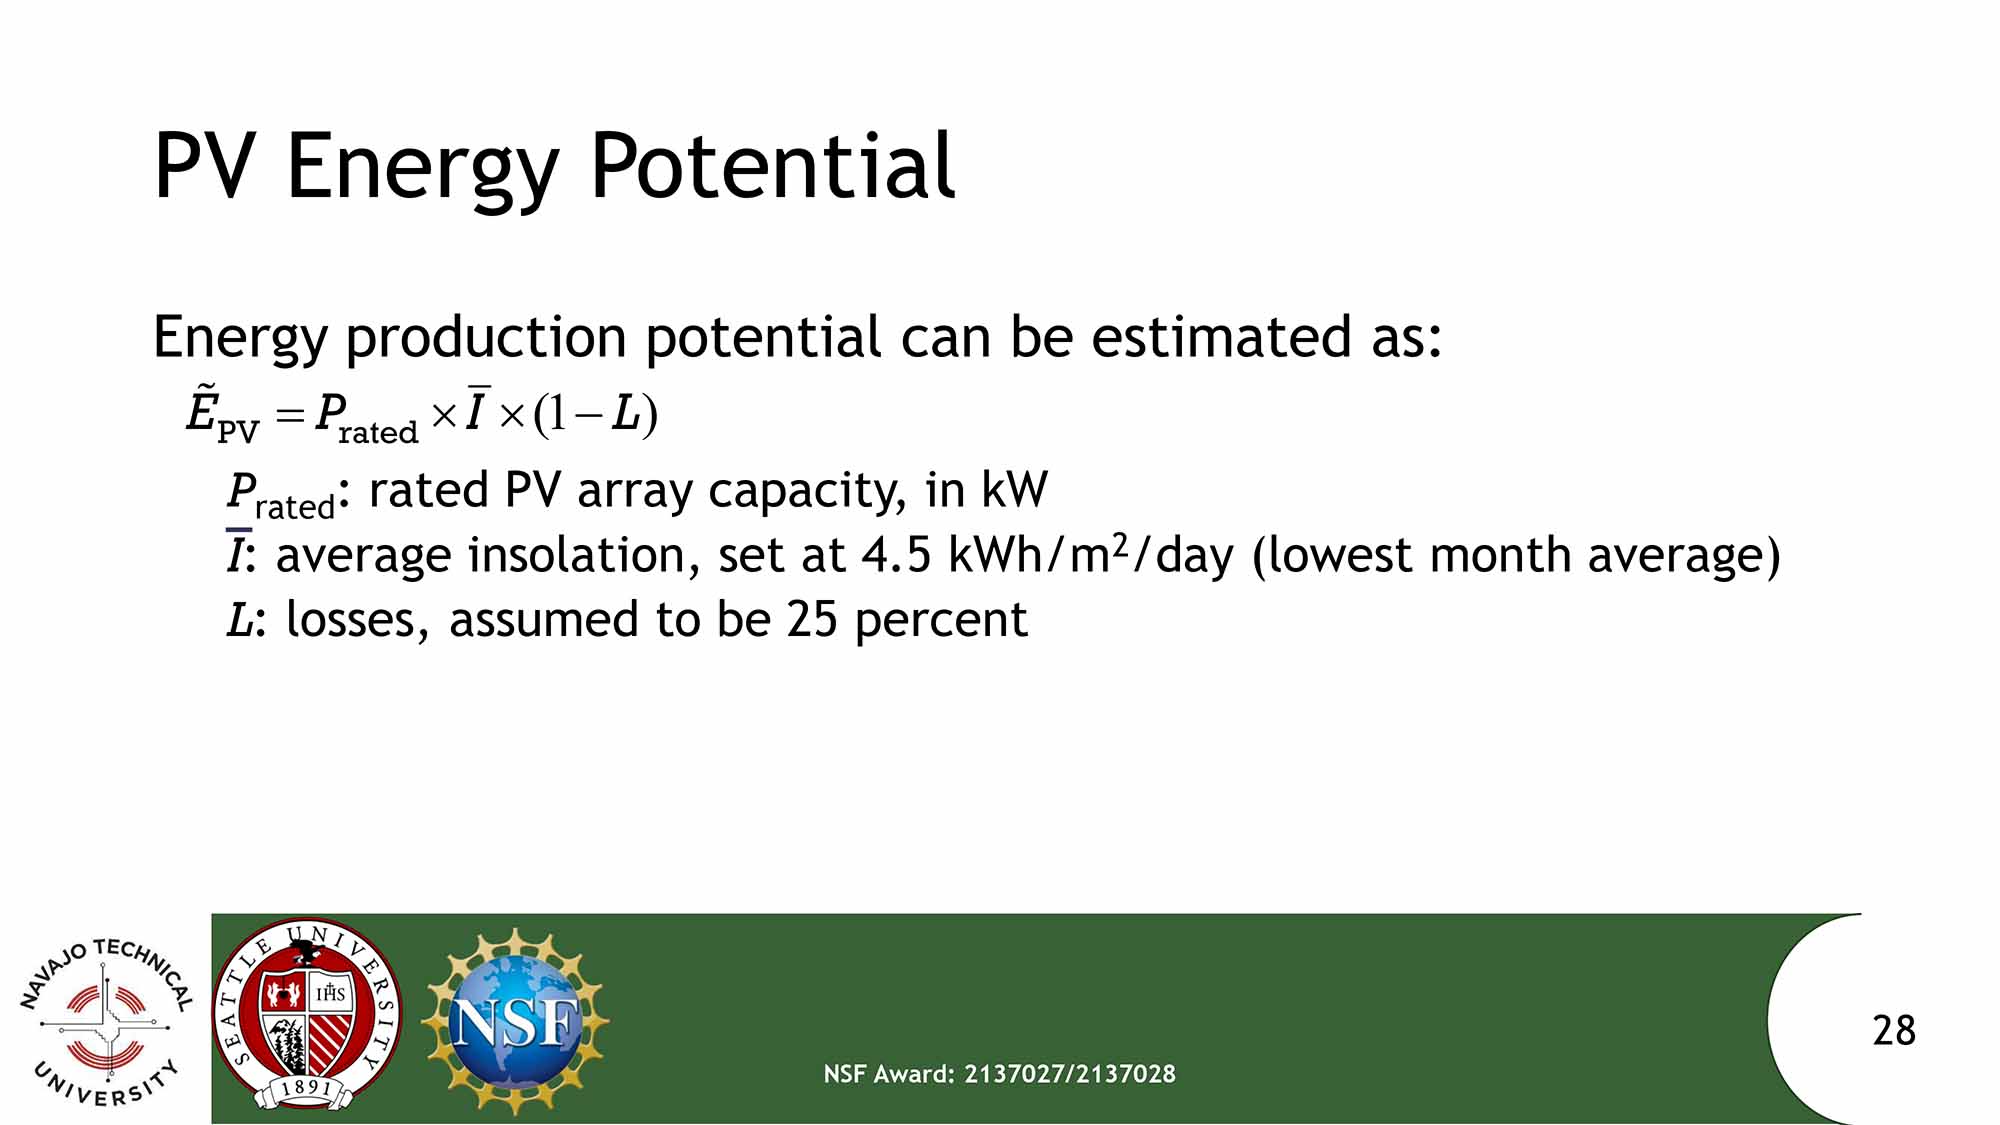
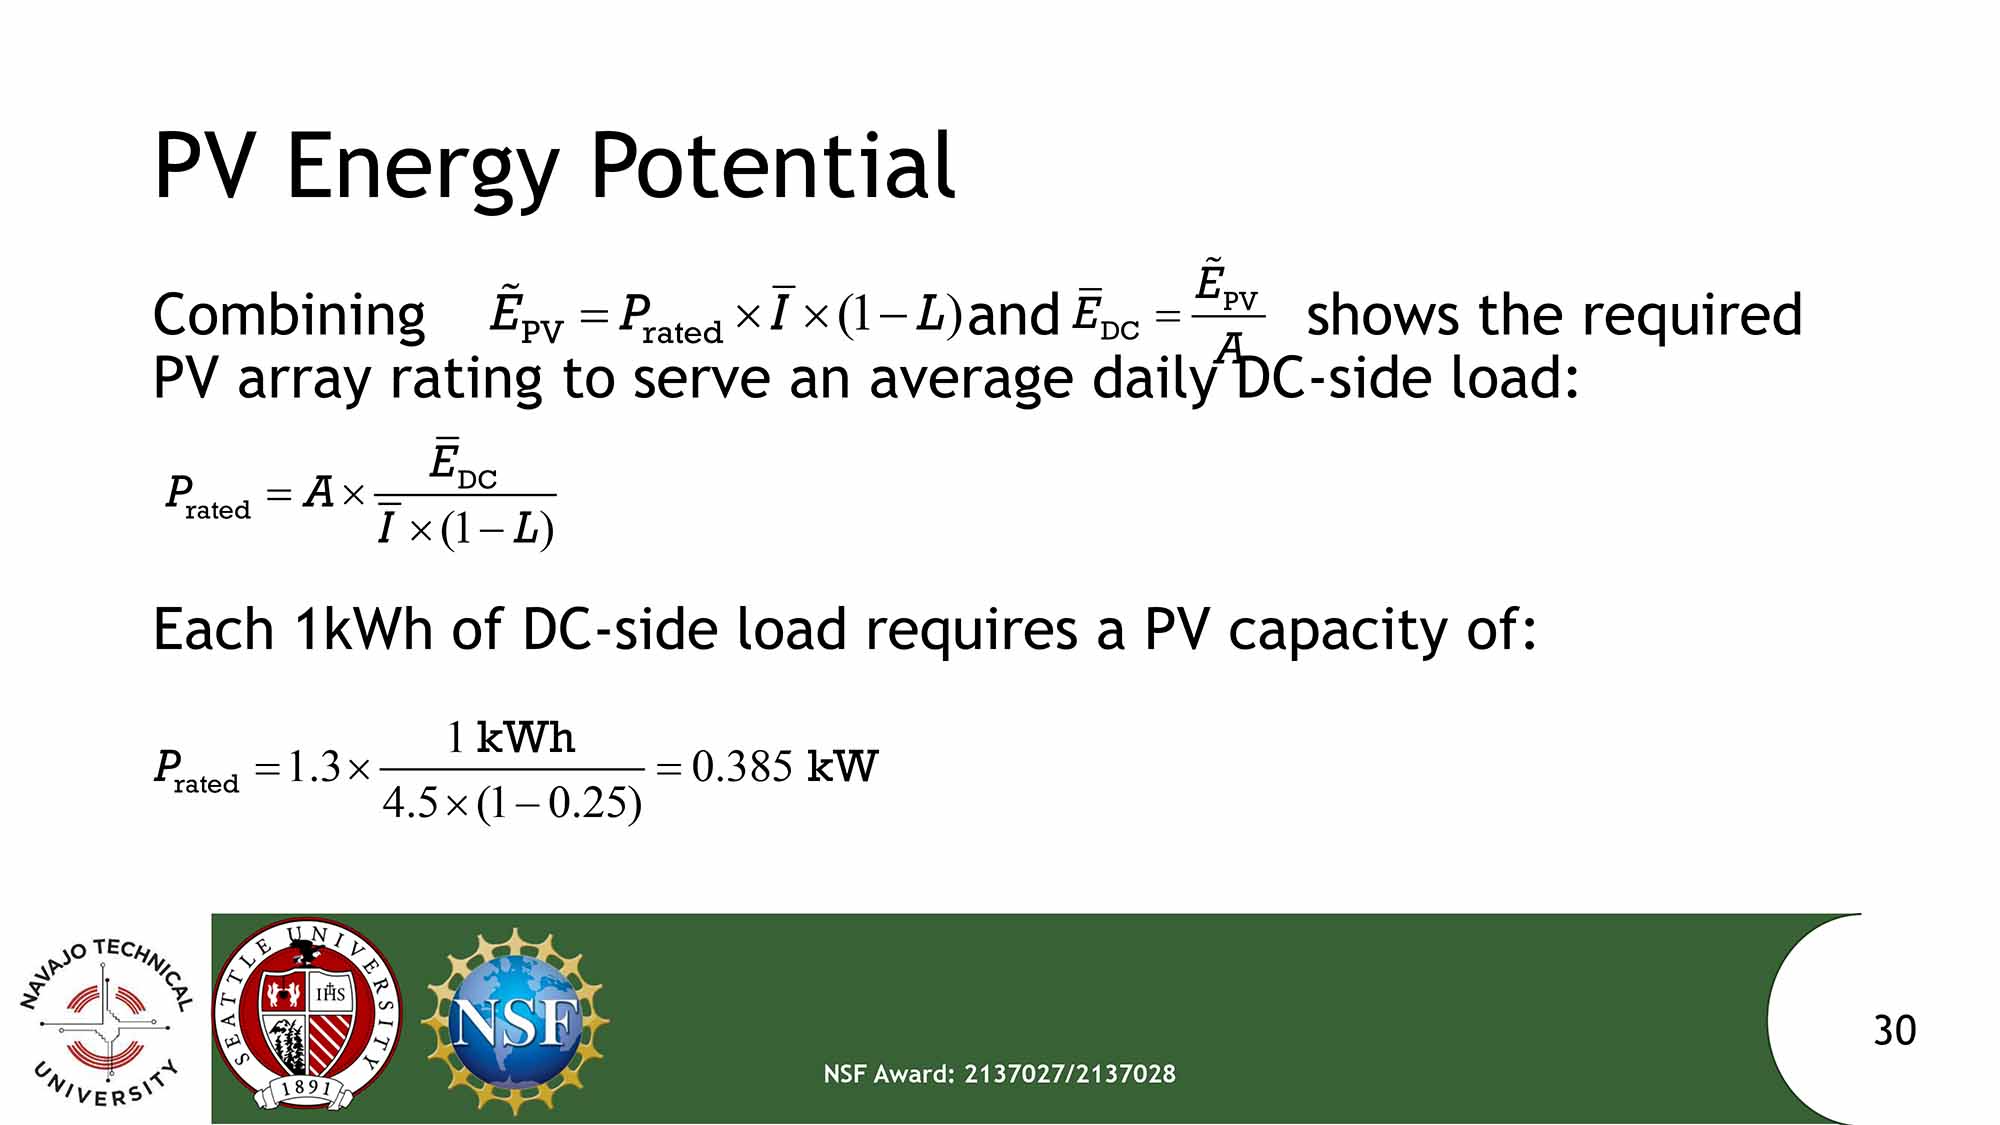 to the next. And you can see that it's fairly consistent with most seasons, sort of in the the the spring and summer months, you have more load that occurs during the day. But more or less, you see that two peaks that generally happen. So what does this all tell us in terms of design? Well, we looked at how the PV arrays are sized based upon the load that was actually recorded. So the first thing that we did in this research was to figure out how much energy could be, we could expect these PV panels to produce. And to do that we use the simple formulation, I don't think I'm gonna go into it in detail. But essentially, you can estimate the energy that that can be produced by PV array, based upon the average installation of the area, accounting for the tilt and the the latitude and longitude and the losses. And we picked 4.2 to be 4.5 kilowatt hours per meter squared per day, that's the January average installation for the homes that have the solar systems. And then from that, we said, well, we need to apply a right to load ratio of about 1.3. Because you have to oversize to some degree, make up for times when the consumption is a lot higher, or the battery charging profile doesn't let you consume as much energy as could be produced. So when we do that, we can take the two equations, and we can put them together, and you come up with a result that for every one kilowatt hour of dc side load requires three 385 watts of PV capacity. So based on those assumptions, for every kilowatt hour of dc side load, that's how much capacity you would need to serve it. And so what we did is we looked at the distribution then of dc side load has figured out how large of a PV array we would have needed now this is retro, I mean, we're looking, we have the benefit of having this data. So we're looking back, we didn't have this data, of course, during the design phase, but what it tells us is that because the consumption is fairly low, the we can serve about 50% of the homes with a 1.7 KW array. And I remember that the arrays themselves are somewhere around here, you know, 3.8 kW. So in some cases, in fact, many cases, the PV array could be made a lot smaller, and and still provide the homes, but it wouldn't be able to provide enough energy for all the homes, right. But it does suggest that an approach maybe in the future would be would be to offer maybe smaller arrays for, you know, maybe half the homes and then the other half could get these larger arrays. And that could be a way of saving money, if interested. A similar approach would be to look at the battery bank sizing,
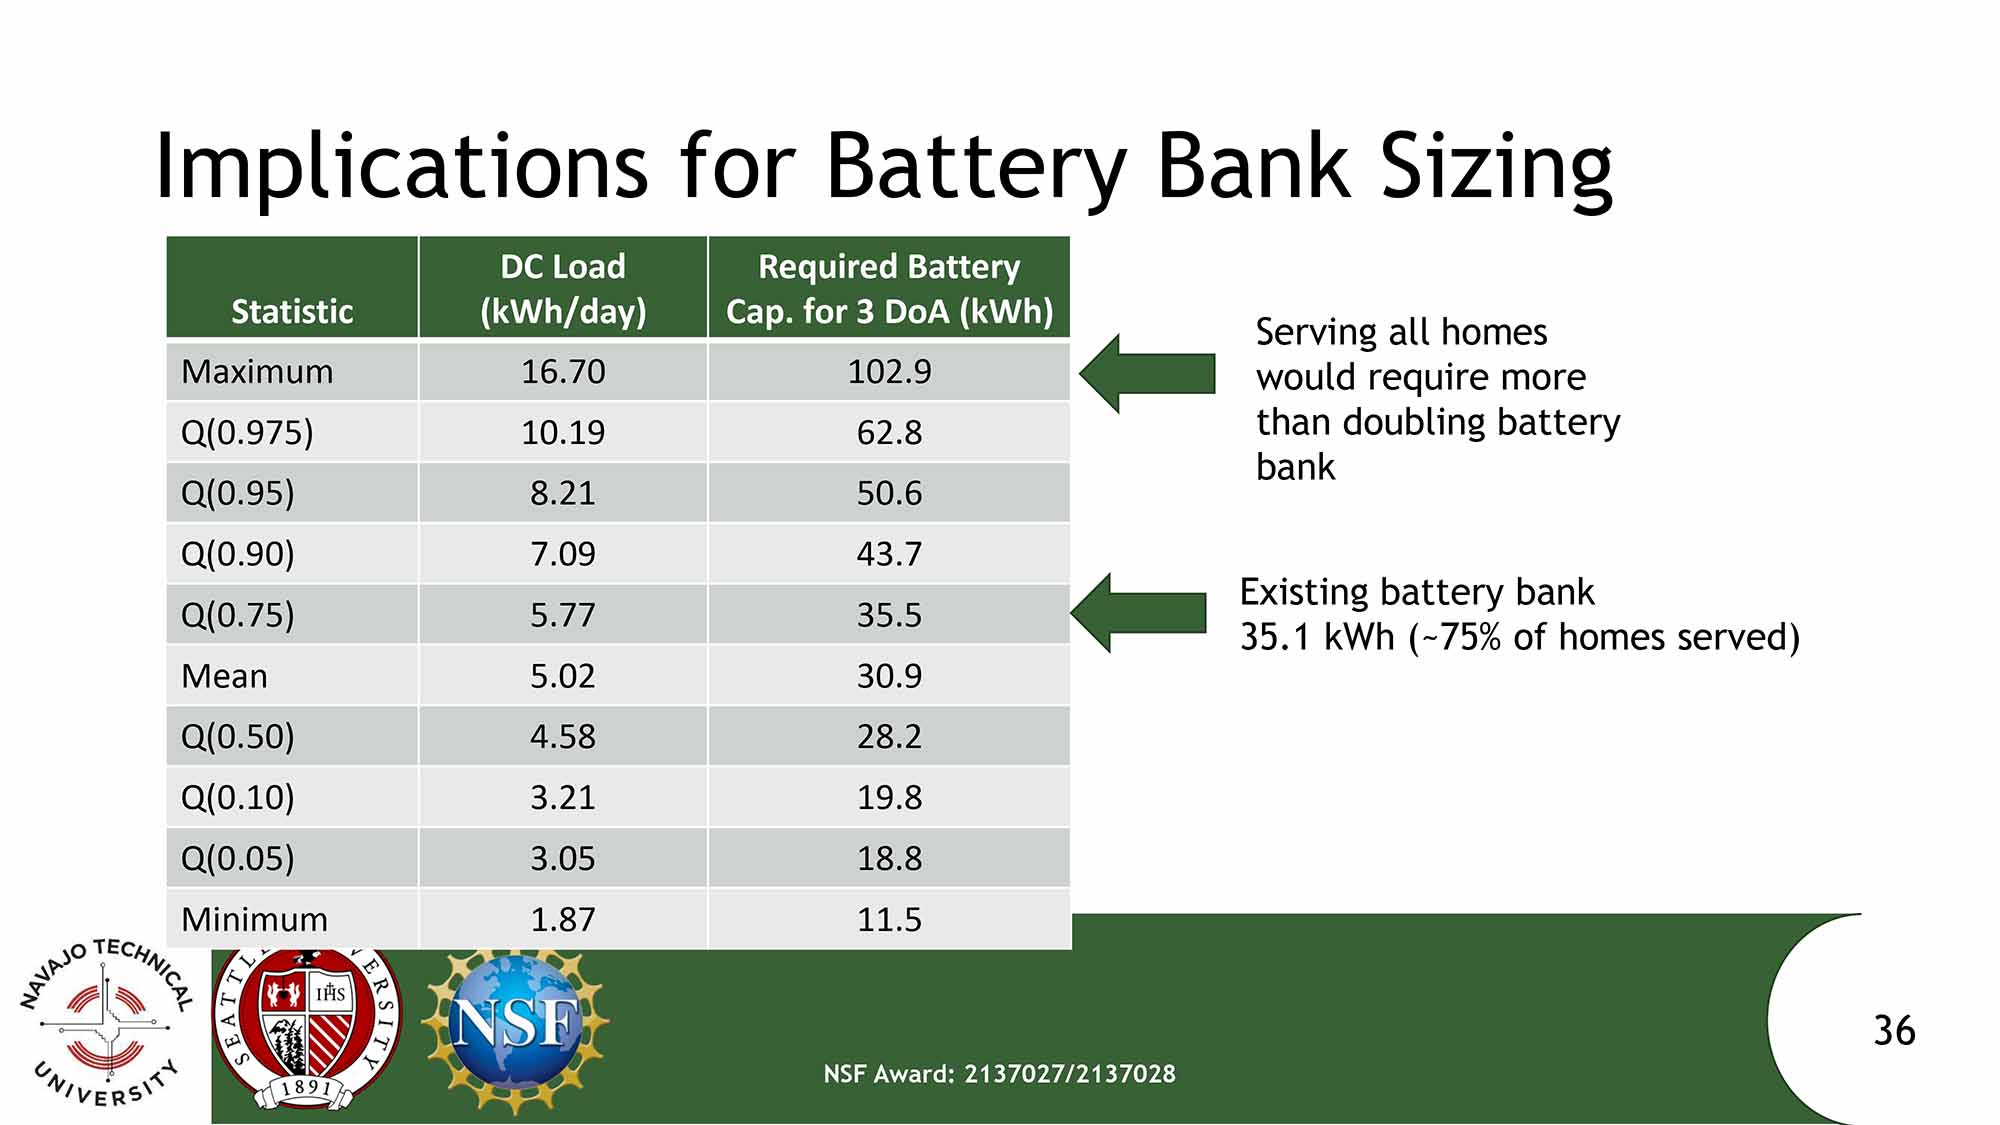
 or we look at the days of autonomy and we do some calculations based upon that. And I think I'll go through this a little bit fast, but we make some assumptions on how the batteries are going to behave over time, how deeply they'll be discharged and what their charging efficiency would be and based upon on these reasonable assumptions, for for every kilowatt hour of dc side load, you need about six kilowatt hours of battery size. So we again can look at the actual DC size, load dc side load and see how large of a battery would need to meet, it took me three days of autonomy. And what we see is that the existing battery banks provide three days of autonomy for about 75% of the systems. So you might say, well, the target was three days of autonomy, this seems to, you know, you're only doing that for for three out of four homes. So maybe the design was off. But to really look at what it would take to provide three days autonomy for all systems, it would require more than doubling the battery bank capacity, which would result in gigantic battery banks. So here, we're highlighting the trade off, right, you know, if you're going to have one design that you stick with, where on this curve, where on this table Do you want to be. And I would argue that meeting 75% of the homes with three days of autonomy is probably a good trade off, the more homes that you serve, the larger the battery bank, you need to have for each home. So let me just point out a few things. Before we talk about future work. What we've kind of shown in this design case study of looking at having the benefit of having now historical data shows a few things. First of all, if you didn't have the data, estimating the size of the load, and the size of your components, it's very difficult, especially in contexts where there's not a lot of literature. also point out the NCUA when they rolled these systems out, we're less concerned about capital costs, and more concerned about getting them rolled out quickly. And having sort of a one size fits all for just efficiency on there. And, and then also, this, as Derek pointed out, the service costs are high getting out to some of these areas can take hours. So you'd rather have maybe your PV array larger than it needed to be if that meant one fewer trip that you had to take a year. So we shouldn't ignore the maintenance and service costs. Now that we're just sort of scratching the surface on the analysis that we can do here. We just like what I presented was just about electricity use, Muhammad is going to briefly talk about some of the future analyses that we're looking at. So go ahead and a holiday.
+3
to the next. And you can see that it's fairly consistent with most seasons, sort of in the the the spring and summer months, you have more load that occurs during the day. But more or less, you see that two peaks that generally happen. So what does this all tell us in terms of design? Well, we looked at how the PV arrays are sized based upon the load that was actually recorded. So the first thing that we did in this research was to figure out how much energy could be, we could expect these PV panels to produce. And to do that we use the simple formulation, I don't think I'm gonna go into it in detail. But essentially, you can estimate the energy that that can be produced by PV array, based upon the average installation of the area, accounting for the tilt and the the latitude and longitude and the losses. And we picked 4.2 to be 4.5 kilowatt hours per meter squared per day, that's the January average installation for the homes that have the solar systems. And then from that, we said, well, we need to apply a right to load ratio of about 1.3. Because you have to oversize to some degree, make up for times when the consumption is a lot higher, or the battery charging profile doesn't let you consume as much energy as could be produced. So when we do that, we can take the two equations, and we can put them together, and you come up with a result that for every one kilowatt hour of dc side load requires three 385 watts of PV capacity. So based on those assumptions, for every kilowatt hour of dc side load, that's how much capacity you would need to serve it. And so what we did is we looked at the distribution then of dc side load has figured out how large of a PV array we would have needed now this is retro, I mean, we're looking, we have the benefit of having this data. So we're looking back, we didn't have this data, of course, during the design phase, but what it tells us is that because the consumption is fairly low, the we can serve about 50% of the homes with a 1.7 KW array. And I remember that the arrays themselves are somewhere around here, you know, 3.8 kW. So in some cases, in fact, many cases, the PV array could be made a lot smaller, and and still provide the homes, but it wouldn't be able to provide enough energy for all the homes, right. But it does suggest that an approach maybe in the future would be would be to offer maybe smaller arrays for, you know, maybe half the homes and then the other half could get these larger arrays. And that could be a way of saving money, if interested. A similar approach would be to look at the battery bank sizing, 
+3
or we look at the days of autonomy and we do some calculations based upon that. And I think I'll go through this a little bit fast, but we make some assumptions on how the batteries are going to behave over time, how deeply they'll be discharged and what their charging efficiency would be and based upon on these reasonable assumptions, for for every kilowatt hour of dc side load, you need about six kilowatt hours of battery size. So we again can look at the actual DC size, load dc side load and see how large of a battery would need to meet, it took me three days of autonomy. And what we see is that the existing battery banks provide three days of autonomy for about 75% of the systems. So you might say, well, the target was three days of autonomy, this seems to, you know, you're only doing that for for three out of four homes. So maybe the design was off. But to really look at what it would take to provide three days autonomy for all systems, it would require more than doubling the battery bank capacity, which would result in gigantic battery banks. So here, we're highlighting the trade off, right, you know, if you're going to have one design that you stick with, where on this curve, where on this table Do you want to be. And I would argue that meeting 75% of the homes with three days of autonomy is probably a good trade off, the more homes that you serve, the larger the battery bank, you need to have for each home. So let me just point out a few things. Before we talk about future work. What we've kind of shown in this design case study of looking at having the benefit of having now historical data shows a few things. First of all, if you didn't have the data, estimating the size of the load, and the size of your components, it's very difficult, especially in contexts where there's not a lot of literature. also point out the NCUA when they rolled these systems out, we're less concerned about capital costs, and more concerned about getting them rolled out quickly. And having sort of a one size fits all for just efficiency on there. And, and then also, this, as Derek pointed out, the service costs are high getting out to some of these areas can take hours. So you'd rather have maybe your PV array larger than it needed to be if that meant one fewer trip that you had to take a year. So we shouldn't ignore the maintenance and service costs. Now that we're just sort of scratching the surface on the analysis that we can do here. We just like what I presented was just about electricity use, Muhammad is going to briefly talk about some of the future analyses that we're looking at. So go ahead and a holiday. 
Muhammad Baum, E4C Sr. Fellow
Thank  you Harry. So, our future analysis will include analyzing battery voltage profiles, in order to give us insight about the reliability of the system, as you can see here in the figure, which provide a typical voltage profile. So, a little after sunset, after sunrise, there is enough solar power for the batteries to recharge, which is evident by the battery voltage increasing rapidly. And this is called the bulk charging stage. And once the battery voltage increases to predefined set points, as you can see observed called the absorption voltage. It's usually for between 4546 to 50 volts depending on the temperature here it's above that then the charge controller regulates the battery voltage as such doesn't damage the battery by over over voltage. And this is called the absorption stage, which can be sold as a few minutes too long the longer hour several hours for example. And when the battery is fully charged battery is fully charged transmission to float stage. And the battery is maintained at a lower voltage. As you can see lasting from about 11am in this graph to 4pm. And this typically this profile just shows a typical behavior it doesn't happen always exactly like this one. But this is typical behavior show in over a year in multiple systems. So we'll be trying to investigate multiple multiple systems sample from system that we have over the year, and see how the behavior is showing in order to give us insight of derivative system. This next slide shows an example of a time series analysis for the battery. This is 10 days chunked in days in January. You can see most of the days where the absorption stage reached. However, there are some some days didn't it didn't reach the absorption. Or sometimes it's different times happen. For example, in January 1, the absorption stage was only reached late in the afternoon. It could mean that the battery was never fully recharged on that day. So we are now investigating if the timing of wind absorption stage is reached and how often it's reached it and also which will give us an insight about the relative system. Next slide. This graph shows the history RAM for the voltage, as you can see here in the system spent significant amount of time at around absorption voltage. So, between 40 and 56 volt. So this does indicate a higher reliability of the system. This graph shows the example of the time at which the absorption stage is first reach for for different unit, some get recharged earlier in the day, which again would suggest that the batteries are being fully recharged. So, now we are at this stage of analysis, we will try to get solicits at what time exactly the battery reach to the recharge to the fully absorption over the year for multiple systems. And we'll compare and see the reliability of the system across the year. So, this is a type of analysis that you can do if you have such data for off grid system. And hopefully we'll get more insight from there is that we have this futurism research.
+1
you Harry. So, our future analysis will include analyzing battery voltage profiles, in order to give us insight about the reliability of the system, as you can see here in the figure, which provide a typical voltage profile. So, a little after sunset, after sunrise, there is enough solar power for the batteries to recharge, which is evident by the battery voltage increasing rapidly. And this is called the bulk charging stage. And once the battery voltage increases to predefined set points, as you can see observed called the absorption voltage. It's usually for between 4546 to 50 volts depending on the temperature here it's above that then the charge controller regulates the battery voltage as such doesn't damage the battery by over over voltage. And this is called the absorption stage, which can be sold as a few minutes too long the longer hour several hours for example. And when the battery is fully charged battery is fully charged transmission to float stage. And the battery is maintained at a lower voltage. As you can see lasting from about 11am in this graph to 4pm. And this typically this profile just shows a typical behavior it doesn't happen always exactly like this one. But this is typical behavior show in over a year in multiple systems. So we'll be trying to investigate multiple multiple systems sample from system that we have over the year, and see how the behavior is showing in order to give us insight of derivative system. This next slide shows an example of a time series analysis for the battery. This is 10 days chunked in days in January. You can see most of the days where the absorption stage reached. However, there are some some days didn't it didn't reach the absorption. Or sometimes it's different times happen. For example, in January 1, the absorption stage was only reached late in the afternoon. It could mean that the battery was never fully recharged on that day. So we are now investigating if the timing of wind absorption stage is reached and how often it's reached it and also which will give us an insight about the relative system. Next slide. This graph shows the history RAM for the voltage, as you can see here in the system spent significant amount of time at around absorption voltage. So, between 40 and 56 volt. So this does indicate a higher reliability of the system. This graph shows the example of the time at which the absorption stage is first reach for for different unit, some get recharged earlier in the day, which again would suggest that the batteries are being fully recharged. So, now we are at this stage of analysis, we will try to get solicits at what time exactly the battery reach to the recharge to the fully absorption over the year for multiple systems. And we'll compare and see the reliability of the system across the year. So, this is a type of analysis that you can do if you have such data for off grid system. And hopefully we'll get more insight from there is that we have this futurism research. Dr. Henry Louis, Seattle University / Kilowatts for Humanity
Yeah, thank you, Mohammed. So that's the work that Muhammad worked on as a EPC. Fellow, and we're continuing on it. So to conclude this this case study, we actually looked at over 100 million data points. To do this analysis of the consumption, average daily consumption on the AC side was 3.58 kilowatt hours per day, which is far lower than grid connected homes in the area, but also about an order of magnitude higher than what you often see in Sub Saharan Africa. So it highlights sort of the difference that context makes not all homes that are powered by off grid systems use the electricity in the same way, there's a wide variety of consumption characteristics that we saw, we saw that, you know, with the benefit of hindsight, probably the PV and inverter sizes could be reduced somewhat and still meet that that demand, or a segmented approach could be used. The battery bank, though, seemed to offer the the desired days of autonomy for a reasonable number of the homes. As Mohamed talking about for next steps, we're going to look at really the battery bank voltage. And what that can tell us, we'll be also looking at load profiles in more detail. We're doing some surveys to figure out and explain some of the characteristics of the consumption that we've seen. We're deploying some data acquisition systems to look at sunlight and to try to figure out how well the PV panels are performing. And we'll also be looking at reliability. This work was funded by the National Science Foundation, there is another partner that we have Navajo Technical University that's been very much involved in this project, although none of the their faculty are presenting today, as well as several other individuals that have contributed to this work. And one one way or another. If you're very if you're interested in this, this is a this top citation for energy for sustainable development. Actually, it was just published, so it's not under revision anymore, is available. And it contains all the details. So with that, I think we're ready for for q&a. Here are our contact informations. And I turn it back over to you. Thank you, everyone.
Iana Aranda, President of E4C
Thank you, Henry. And a number of questions have already come in, I'm gonna let you keep sharing your screen just in case you want to reference any slides and answering the questions that have already come in. And I welcome our listeners to go ahead and put questions into the q&a so we can keep track of them. So a number of questions came in specifically for you, Derek, related to the NCUA and more of the administration in terms of who finances the MTU a, what the revenue model is, if you can speak to that, briefly, please.
Derrick Terry, Navajo Tribal Utility Authority
Basically, everything in our area we worked off of the Rural Utility Services. So it's a it's a department that's located under the USDA, so United States Department of Agriculture. So they they luckily for us that we qualify for low interest long term loans. And so that gives us the ability to, you know, finance a lot of these projects that are happening recently with the, with the administration, that as it is, you know, with with the pandemic that we, you know, just went through are going through with COVID. They had released on the cares funding. So the affordability act, I believe were the second one. So it was the arpa. So you got the Cares Act and you got to arpa. So there's a significant amount of money that was channeled through the Food Administration here. In the United States, so we got quite a bit of money that would help us with COVID relief. And as a result, we're able to direct that towards a lot of the families and use the funding to purchase a lot of these solar units. For, you know, due to care, Zack, as well as that ARPA Sun, which is the American Relocation Act, I believe it is, I don't, I don't remember what the acronym acronym stood for. But those are two significant, you know, funding vehicles that were able to use.
Iana Aranda, President of E4C
Fantastic. Thank you so much for providing some of that insight. We also have some very specific system design questions. Probably more for Henry and Mohammed, considering the huge variation in load profiles. Have you explored the possibility of designing standalone systems for some households, the outliers in particular, instead of fully interconnecting the system?
Derrick Terry, Navajo Tribal Utility Authority
Yeah, I mean,
Dr. Henry Louis, Seattle University / Kilowatts for Humanity
good question. You know, to be clear, this, all of these systems are off grid, and none of them are interconnected with with any other any other system. So they're all standalone, I think it's really interesting to look at the outliers. Because those are the homes that are consuming lots of energy, which you usually want, right? If you're going to install a solar system, you're gonna want people to consume a lot of energy. Unfortunately, just looking at the data alone doesn't tell us what these people are using it on what you know, what conditions they're in what demographics slice they are, we're going to be looking into that with some of the surveys that we do. But the very brief exercise that we went through in this webinar about well, once you have the data, you can use that to figure out how big of a system you would need, it does uncover the fact that, that there are some homes that are really out there on the tail end, if you design all the systems to meet the needs of that, that one home that consumes the most, you actually end up with very, very large systems that for quite frankly, would be a waste of money and just sort of impractical to, to install. So understanding that distribution of consumption, I think is really important. If you were to try to have a segmented approach, right? If you didn't want to do a one size fits all, if you wanted to come up with two options or three options, understanding where on the curve, each of those options would would serve as is quite important.
Iana Aranda, President of E4C
It's excellent. And there's a lot of questions about the batteries and now zeroing in on that what is the lifespan of the batteries? Most especially maintenance, it's it's a killer that most of the areas where these batteries are used or low income areas and also in most cases, these barriers are not produces for example, in this instance, from the question in Sub Saharan Africa
Derrick Terry, Navajo Tribal Utility Authority
Derek Do you want to start I can start and then you can follow up on this specific scenario. So so the batteries you know that we contacted or that we've contracted with has have a have a warrantied lifespan of five years. And so and these are maintenance free batteries, I believe their AGM batteries, so augmented glass mat batteries. So what the whole point of the reason why I wrote them is to kind of ease the amount of time that we have our cruise to get on site with them. So before we had these batteries, we had the lead acid batteries, so the flooded lead acid batteries. So for you all that are that are familiar with these type of batteries, you have to refill them with distilled water. And so that takes a lot of time, then there has to have a established crew on site and with a reliable vehicle to constantly be out every three months to refill these matters. So what the added amount of units that we had on we just we just couldn't do that. So we made the change for maintenance free battery, which are limited amount of time that we go out and service these units. So currently what we have in the systems are the are the maintenance free battery AGM batteries, as well as set though lithium batteries. So Henry can probably talk a little bit more on the specifics and you know, talk about the report.
Dr. Henry Louis, Seattle University / Kilowatts for Humanity
Yeah, sure. So, is there it said the the batteries that we looked at here, are they you know, I think they're gel, not not just AGM gel batteries. There's another set of units that use lithium ion batteries. The ones here are gel. The you know, one thing you have to understand with battery life is usually manufacturers do tests in very controlled conditions with constant current and, you know, room temperature. And as they're talked about, there's four seasons where right where these are exposed to, and they're not in any sort of temperature controlled environments, so they're exposed to the hot temperatures, cold temperatures, I'm sure that effects and will affect their performance and overall lifespan. So, you know, the kind of the jury's still out on how long they're gonna last. And how they're going to be performing. It's certainly a consideration if anyone else is thinking about doing a similar project is to think about battery, the battery selection and really understand how batteries are rated. And it's usually not for environments that aren't temperature controlled, where they can get snowed on, they can get heated up pretty, pretty high temperature as well.
Iana Aranda, President of E4C
Yeah, looks like this. There's a lot of questions about just operation of various batteries experiences that are people are sharing regarding struggles to recharge the bank sufficiently to maintain health. So definitely a common issue here. I am going to I can tell the audience that we have a lot of questions. And I, I suspect we're not going to be able to answer all of them on go we I do want to see if our speakers will be kind enough to perhaps do a follow up and addressing some of these questions offline. But there are two questions have come in that are related to each other in terms of designing other systems based on these learnings. So the specific question here is what tools and resources would you recommend in sizing a system without a data set like this? And are there any metrics that you didn't measure that would have benefited you greatly?
Dr. Henry Louis, Seattle University / Kilowatts for Humanity
Oh, wonderful questions. So you know, if you are don't have the benefit of historical data, really, this kind of the state of the art is to do surveys, or try to do a bottom up approach where if you have some control over the number of appliances that are out there, you estimate how many appliances of which power rating, there's going to be how long they're going to be used, and you build a load profile up like that there are several universities that have developed tools that will help you come up with a, you know, realistic ish profile. But really having historical data is where it's at. I mean, you there are some data sets that are out there. If you look at our paper, we do provide, I think enough of the the statistical characteristics to get you started. But it's extremely hard to do with that historical data. If you do do the survey approach, where you ask potential users, what appliances you might have, how long are you going to use it, take any response that you get with a grain of salt, we've done other research, where we assumed the survey methods to be off by like 300%, where people tend to overestimate in particular, that tariff structure also affects how much people will consume, especially in extremely low income settings. People might, when you survey them, it might say they're gonna use all this electricity. But then they get the bill for it in practice, and they say, Well, you know what, we actually can't afford to use that much. And so you might be extremely developed, extremely disappointed. I will point out that a couple of years ago, I did do a webinar series for engineering for change. And in one of those modules, we did talk about load estimation, and how to incorporate that the tools that you can use to design the system, once you have an idea of the load. I mean, there's many out there, personally, myself and my nonprofit we rely on on Homer, which is a really good tool, again, to make it to get valuable information from home or you have to put in good information. And that includes the load. I think there was a second part of the question about what data do we wish we had measured. I think having some sunlight data, the radiance data Piron ometer, installed with some of the solar arrays would be really helpful for letting us understand how the solar arrays are performing. This is something that we're retro actively putting out in some of the units. In fact, Navajo Technical University is working on that design installation. They're leading that effort. So we'll be putting some of those out there. But that's probably the one piece that I wish we had.
Iana Aranda, President of E4C
That's excellent. I think we're taking our last question. And this is one that I think there's also a little bit of a recurring theme in the questions around which was, can you describe the monitoring system a little bit more? How does the data get transmitted to the folks doing the monitoring and there's just generally interest in understanding data flows before the systems
Dr. Henry Louis, Seattle University / Kilowatts for Humanity
Yeah, so NCUA when they, when they put out their request for proposals specified that the solutions had to have better data acquisition capability. So the vendor that they went with us is Sam, sarah and sam. Sarah is you know, an industrial data acquisition company. I mean, this is what they do. And so they installed it, I believe it's all they collect data, they sample the data, I believe it's pushed out through the cell network to just the cloud, essentially. And we're able to access it through just an API. So I really just have a Python script that we run every so often, that downloads the data and ends up being there's about 50 fields of data that it that come from each unit, sometimes multiple, multiple times a minute, for hundreds of units, it ends up being a tremendous amount of data that needs to be ingested and processed. But I think it's been really a highlight of this work. It's been able to get such high quality data. It's really remarkable, amazing, because some of these locations are really, really remote. I mean, really remote.
Iana Aranda, President of E4C
Indeed. Well, we have arrived at the end of our time together, I apologize, we have something like 20 More questions that went unanswered, because this topic is obviously of tremendous interest to our audience and relevance, globally. So I want to thank all of our speakers today, Muhammad Henry. Derek, it's been such a pleasure learning more about this particular case study and hearing the necessary details about how your work has advanced accessibility and how we'll help others design similar systems. So we will try to get to some of the questions that went unanswered. Please do follow us  on you for see to hear more about where you can see some of these questions and dressed and for snippets of this particular webinar. And we've shared the link to the webinar series that Henry generously provided previously, that includes a lot of detailed guidance on on how to load estimation amongst other topics. With that, I want to wish all of you a good morning and good evening or good afternoon, or looking forward to seeing you on another webinar soon. And thank you all so much for your attention, your time and your thoughtful questions today. It's been a fantastic conversation. Enjoy the rest of your day everyone. Take care. Thanks
+1
on you for see to hear more about where you can see some of these questions and dressed and for snippets of this particular webinar. And we've shared the link to the webinar series that Henry generously provided previously, that includes a lot of detailed guidance on on how to load estimation amongst other topics. With that, I want to wish all of you a good morning and good evening or good afternoon, or looking forward to seeing you on another webinar soon. And thank you all so much for your attention, your time and your thoughtful questions today. It's been a fantastic conversation. Enjoy the rest of your day everyone. Take care. Thanks